Running a business is not easy. Between attracting and retaining customers and employees, staying ahead of your competition, keeping your costs down and driving continuous improvement in systems and processes, it’s easy to lose focus from executing on each of these as effectively as you need to. Knowing where you are succeeding or struggling is essential to ensure that you can respond to an issue or redeploy resources to course correct in a timely manner. Easier said than done, right? With so many balls up in the air, how can a business owner efficiently leverage their time to only focus on the metrics and results that have the greatest impact on their business, without pouring through pages and pages of financial statements where everything seems to get blurred? The answer is key performance indicators (KPI’s) and dashboards. KPI’s can consist of both financial and nonfinancial data. If identified appropriately, they enable a business owner to monitor a relatively limited number of data points to measure the organization’s financial success without getting into the details excessively.
KPI’s for Service Businesses
Depending on the type of business that you are operating, the KPI’s will vary. For example, in a services business, where the asset being sold is time, data that has the most significant impact on an organization’s performance are billable hours, utilization and realization, all nonfinancial data.
- Billable hours are self-explanatory; the number of productive hours worked by your employees that you have the opportunity to bill your clients.
- Utilization is a measure of the ratio of time that your employees work on billable activities compared to the total hours worked. For example, if one of your employees works a 40-hour workweek, but spends 10 hours per week performing administrative functions not directly billable to a client, their utilization for that week would be 75% (30/40).
- Realization is the measure of the time spent on billable activities compared to the time you are able to actually bill and pass onto your clients. For example, if an employee works on a client for 30 hours, but you are only able to bill your client for 20 of those hours, their realization would be 66% (20/30).
So as you can see, none of these KPI’s even appear in a traditional financial statement, yet are strong indicators of how well your organization is performing. These are just a few of the drivers in a service-based business that might appear on a dashboard.
KPI’s for Product Businesses
Let’s contrast the service-based business KPI’s above with the KPI’s that are common to an organization whose asset sold is a product. In a product-based environment, the most common metrics that are critical to their financial success (aside from pure sales dollars) consist of KPI’s such as gross profit % and sales product mix. Let’s take a retail lumberyard as an example. They have a diverse product offering with varying gross margins.
- The gross profit % in this industry is comprised of the accumulation of the gross profit on both low margin and high margin products that average out to an overall gross profit %. Any variability in the gross profit %, either favorable or unfavorable, has a significant direct impact on the bottom line.
- Product mix is important because it drills down even further on the gross profit %, providing a more granular analysis of the mix of products being sold that are driving the overall gross profit. If a business owner wants to drive the overall gross profit up, and they have the choice of pushing lumber (which is more commoditized and therefore lower margin) or windows and doors (which are more specialized and higher margin), driving their sales team to increase penetration of these specialty products with their customers will greatly impact the ability to pull margins up. Without visibility to sales product mix, there is no ability to understand the current to influence the future.
These are just a few examples of KPI’s for service and product based businesses.
KPI Dashboards
While there are “common” KPI’s, the real power of KPI’s comes from developing custom KPI’s for your business based on your organization’s short and long term goals and objectives. What was relevant one year may not be “key” the next.
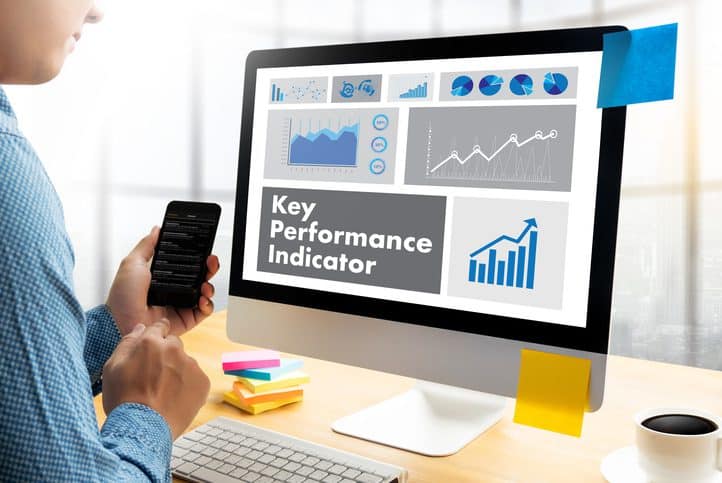
A dashboard is a summary reporting mechanism created to accumulate all of these KPI’s onto one succinct report. Since a dashboard consists of both financial and nonfinancial data, these KPI’s cannot be typically generated by pushing a button. Instead, data from accounting and other technology systems must be gathered and input into a tool that produces the information and related calculations in the form of KPI’s. Some of the data inputted raw may be the KPI itself and other KPI’s will need to be calculated using two or more raw data inputs. Having this dashboard ensures that there is clarity surrounding what information you want to see daily, weekly and monthly and provides a consistent and abbreviated presentation of the information that you should focus on the most to drive the success of your business.
At LGA, our Outsourced Management Accounting and Business Consulting teams work seamlessly with organizations to identify, build and drive meaningful information to business owners. Call us today to help you bring financial focus to your business.
By John Geraci


