Let’s face it, accounting and bookkeeping may seem like arduous tasks for most business owners. Also, standard reports like the Balance Sheet and the Profit & Loss Statement can be difficult to interpret when making decisions. There are probably many other activities related to your business you’d rather be doing than reading historical reports. However, to gain insight on where you need to focus your efforts you need better financial information. Choosing the right Key Performance Indicators (KPIs) and monitoring them with a Financial Dashboard will set you on the right track.
What are KPIs and Dashboards?
Key Performance Indicators (KPIs) are simply financial or non-financial metrics calculated from your financial results that can be used to evaluate financial success. A Dashboard is a tool that helps track all of your relevant KPI’s. Using these tools provides data for decision making, monitoring results, comparisons to industry averages, etc. The following are three examples of useful KPIs:
1. Gross Margin Percentage– Gross margin percentage is Sales less Cost of Goods Sold divided by Sales. This measures how much of each dollar of sales is left as profit after accounting for the cost of the goods sold that is available to pay all your other expenses. These help you identify any upward or downward trends of sales and purchases. With the monitoring of this KPI closely you can keep a pulse on the business and may be able to implement changes before any major surprises occur during the year. Examples may include economic downturns, cost increases to determine revenue increases or even possibly indications of misappropriation of assets.
2. Days Sales Outstanding (DSO) – Accounts Receivable divided by Sales times the number of days in the period. For example, if this calculation is done at year end, the period would be 365. This measures the number of days it takes to collect cash from your sales. If your business consists of high volume of receivables you may be familiar with the cash crunch during certain times of your “seasonal” business cycle. Each industry’s DSO is different so calculate your company’s DSO for the prior 3 years to determine a benchmark. An upward trend may indicate collection issues and a downward trend may indicate collection improvements.
3. Current Ratio – Current Assets divided by Current Liabilities. This is a type of liquidity ratio that measures a company’s ability to cover its current liabilities. In general, the higher the ratio, the better the company’s liquidity is. An example of why a business should monitor this ratio periodically is to ensure that the company has enough borrowing capacity on a line of credit to cover short-term financing needs. For example, if Accounts Receivable collection periods start to extend and your DSO increases you may find yourself in a cash crunch.
Dashboards
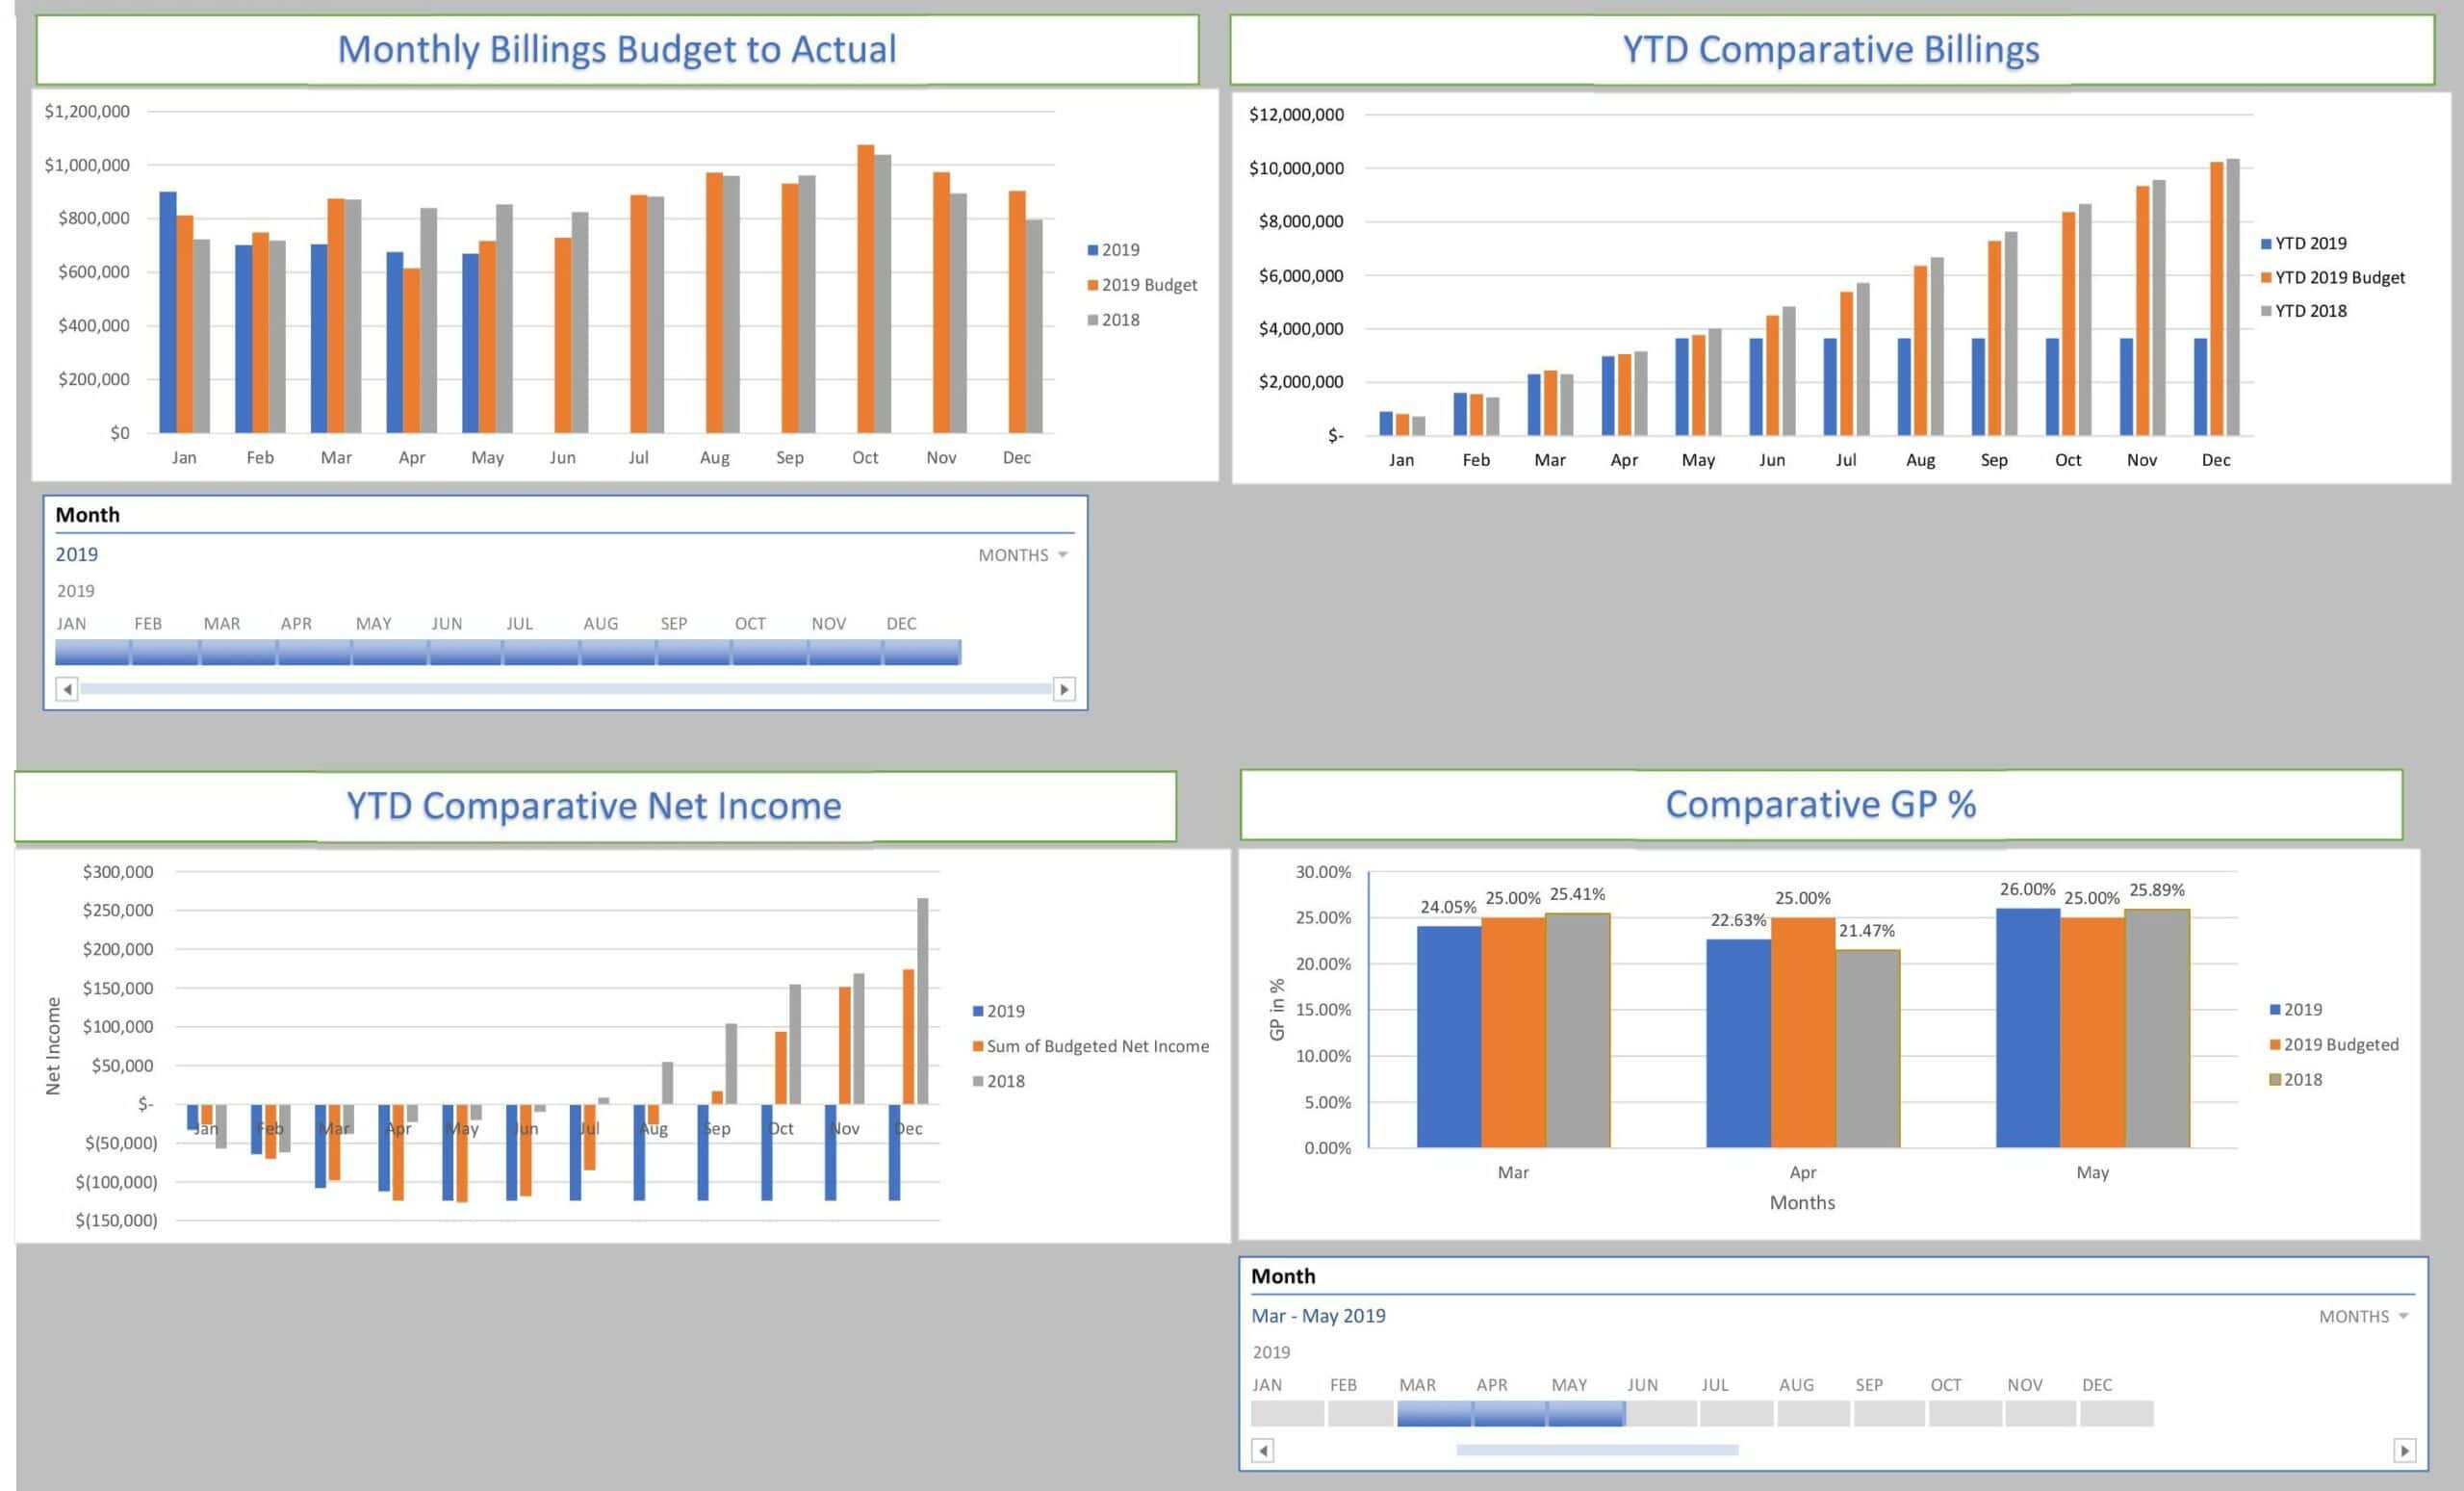
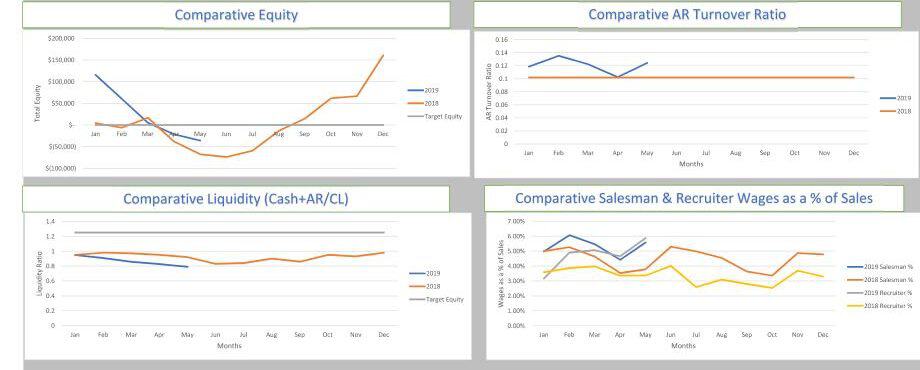
A dashboard is a tool that displays the data needed to measure your chosen KPIs in an easy to understand way. A variety of third-party dashboards exist, and some companies choose to create their own. Here are a few examples of what a dashboard might look like:
The calculation of KPI’s and monitoring these on Dashboards allow the user to access financial metrics in one place in an easy to read format. The information originates from your accounting system and is performed after the closing process to provide a useful management tool to recap the specific data in which you need to make timely management decisions for your business. This will allow your “historical” data as presented in the Balance Sheet and P & L Statement the additional benefits of providing timely, reliable and relevant information. Wondering what KPIs you should be measuring for your business? Our Outsourced Management Accounting team would be happy to discuss your needs. Contact us today.
by Shawn Christman


